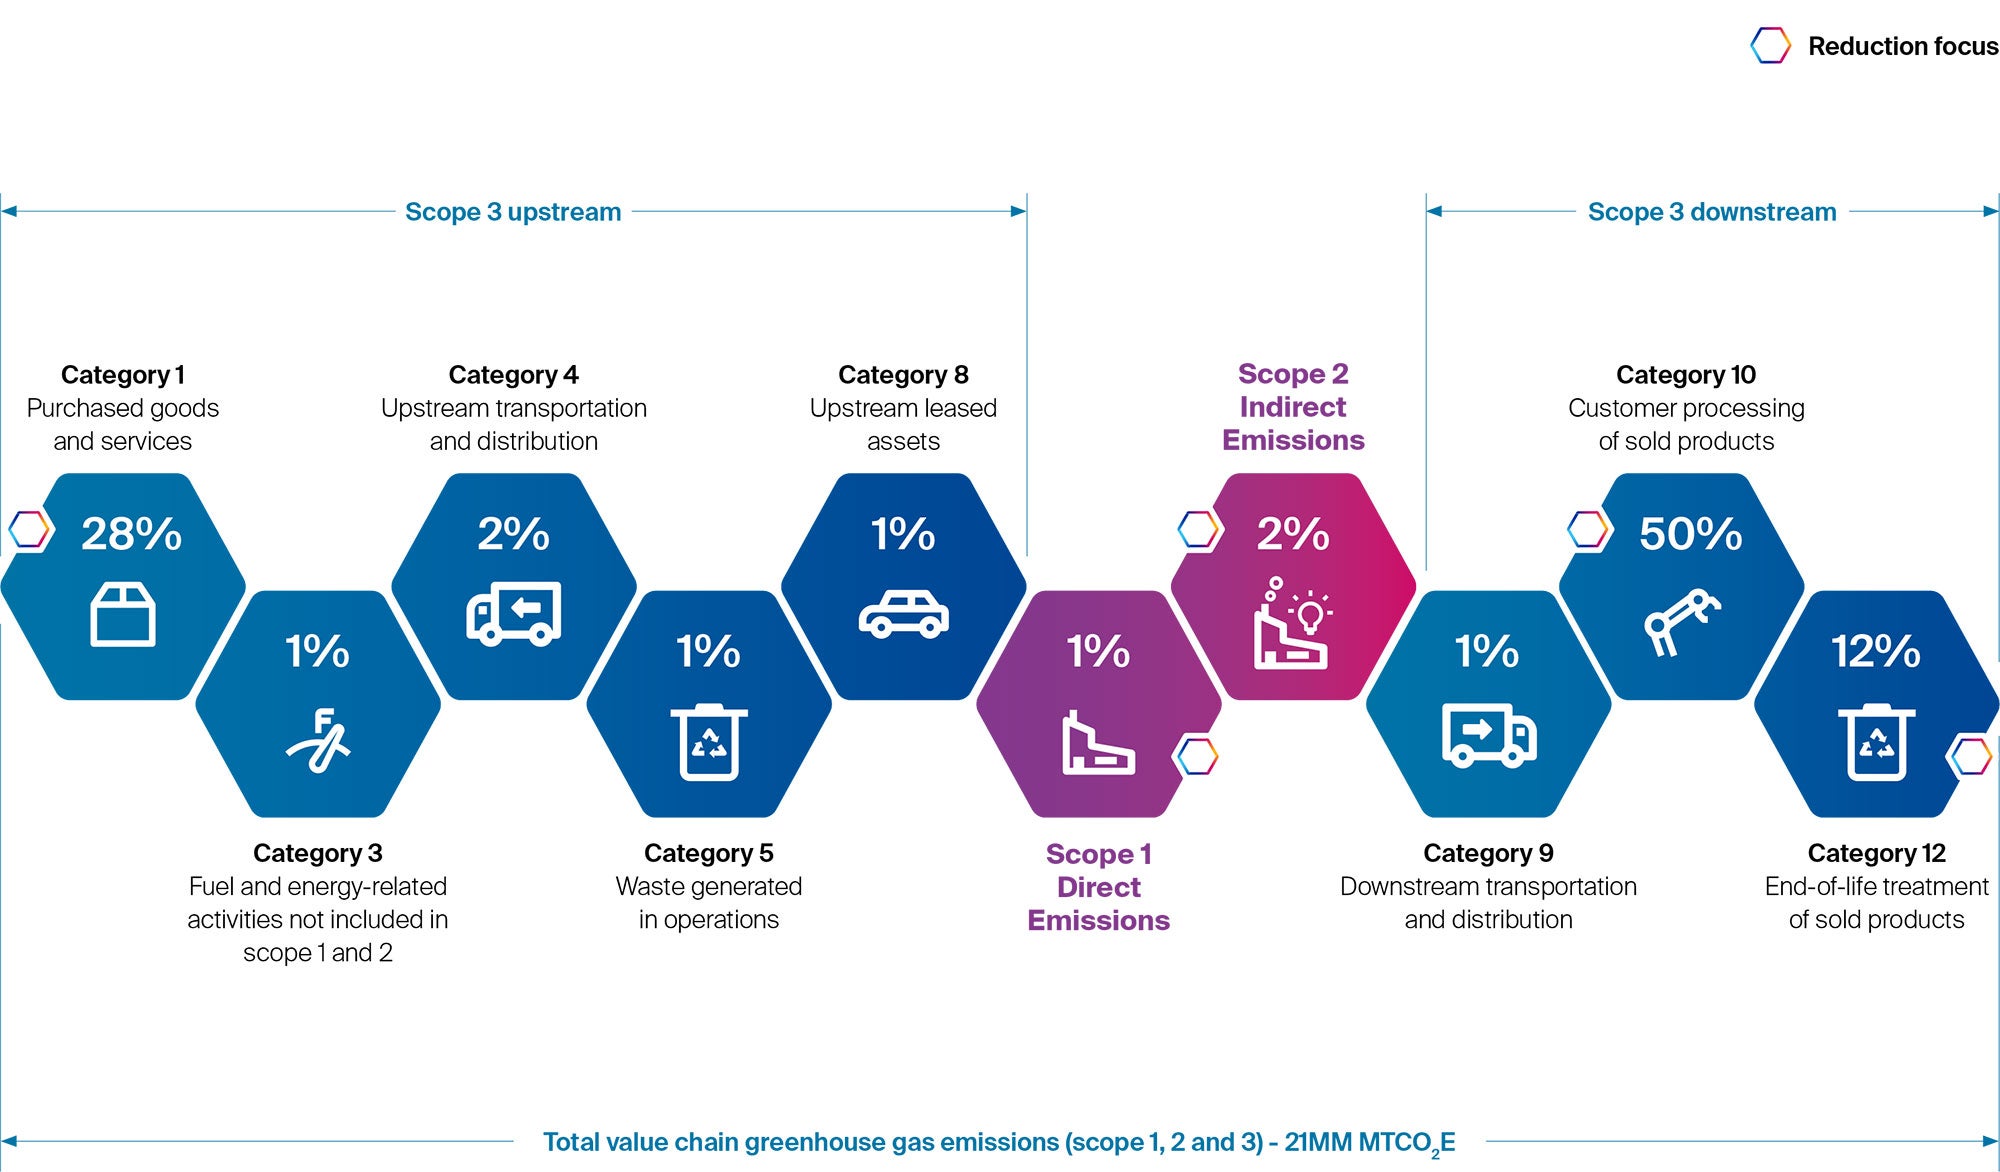
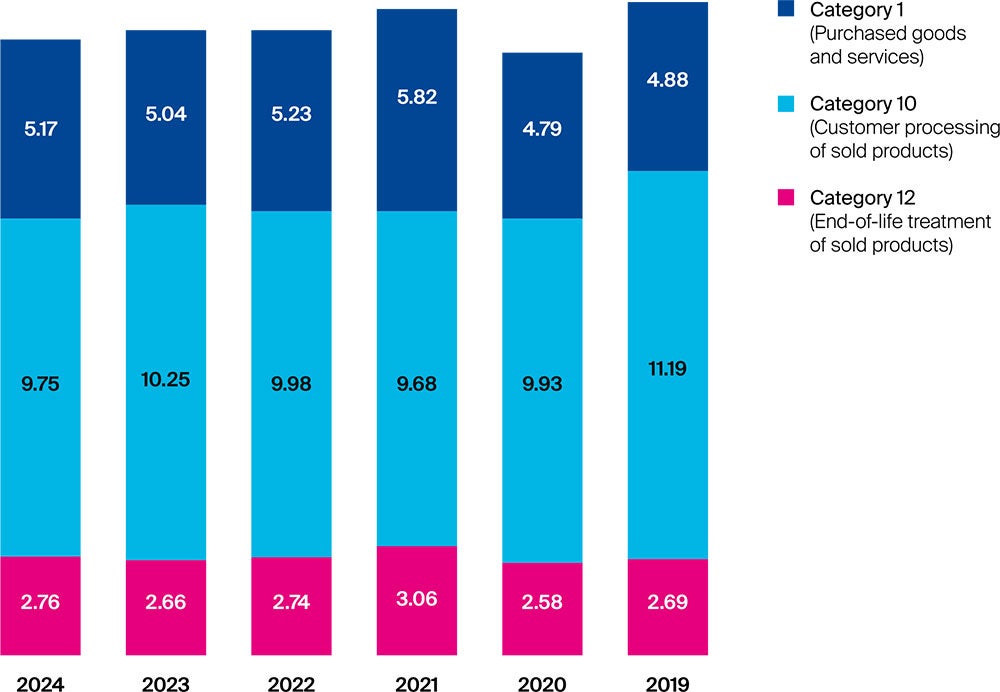
Scope 3 greenhouse gas emissions
Million metric tons of carbon dioxide equivalent
Other air emissions
While we do not report hazardous air pollutants (HAPs) on a global level, we do track those emissions at our U.S. facilities. In 2024, our U.S. operations emitted 168 metric tons of HAPs. As we reformulate products to enhance their environmental performance, our emissions of hazardous air pollutants should decrease over time. Learn more in the product stewardship section.
For more detailed information about our approach to reducing energy use across our operations and GHG emissions, see the bottom of this web page.
Multi-year data highlights
Greenhouse gas emissions
Million metric tons of carbon dioxide equivalents
Scroll right to view further data »
| 2024 | 2023 | 2022 | 2021 | 2020 | 2019 |
| Total (scope 1 and 2) | 0.63 | 0.67 | 0.68 | 0.69 | 0.70 | 0.77 |
| Direct (scope 1) | 0.26 | 0.26 | 0.27 | 0.28 | 0.27 | 0.30 |
| Indirect (scope 2) | 0.38 | 0.41 | 0.41 | 0.42 | 0.43 | 0.48 |
| Value chain (scope 3)* | 17.68 | 17.95 | 17.95 | 18.56 | 17.31 | 18.76 |
Data changes from prior reporting reflect updated data and adjustments for acquired and divested locations from the 2019 baseline onward.
* Categories: purchased goods and services (category 1), processing of sold products (category 10), and end-of-life treatment of sold products (category 12).
Greenhouse gas emissions intensity
Metric tons of emissions per metric ton of production
Scroll right to view further data »
| 2024 | 2023 | 2022 | 2021 | 2020 | 2019 |
| Total | 0.19 | 0.20 | 0.19 | 0.19 | 0.20 | 0.20 |
| Indirect (scope 2) | 0.08 | 0.08 | 0.08 | 0.07 | 0.08 | 0.08 |
| Total | 0.11 | 0.12 | 0.12 | 0.11 | 0.12 | 0.13 |
Total intensity data include direct and indirect emissions. We report greenhouse gas as carbon dioxide equivalents for carbon dioxide, methane and nitrous oxide. Data changes from prior reporting reflect updated data and adjustments for acquired and divested locations from the 2019 baseline onward. Total may not equal the sum of direct and indirect due to rounding.
Air emissions
Metric tons
Scroll right to view further data »
| 2024 | 2023 | 2022 | 2021 | 2020 | 2019 |
| Particulates | 134 | 126 | 178 | 150 | 153 | 162 |
| Volatile organic compounds | 1,864 | 2,570 | 2,042 | 2,111 | 1,818 | 2,334 |
| Nitrogen oxides | 448 | 457 | 544 | 566 | 577 | 782 |
| Sulfur dioxide | 48 | 31 | 44 | 53 | 57 | 75 |
Data changes from prior reporting reflect updated data and adjustments for acquired and divested locations.
Air emissions intensity
Metric tons of emissions per 1,000 metric tons of production
Scroll right to view further data »
| 2024 | 2023 | 2022 | 2021 | 2020 | 2019 |
| Particulates | 0.04 | 0.04 | 0.05 | 0.04 | 0.04 | 0.04 |
| Volatile organic compounds | 0.55 | 0.75 | 0.58 | 0.56 | 0.51 | 0.61 |
| Nitrogen oxides | 0.13 | 0.13 | 0.15 | 0.15 | 0.16 | 0.21 |
| Sulfur dioxide | 0.01 | 0.01 | 0.01 | 0.01 | 0.02 | 0.02 |
Data changes from prior reporting reflect updated data and adjustments for acquired and divested locations.
Energy intensity
Gigajoules per metric ton of production
Scroll right to view further data »
| 2024 | 2023 | 2022 | 2021 | 2020 | 2019 |
| Total | 2.63 | 2.37 | 2.34 | 2.28 | 2.30 | 2.36 |
| Direct | 1.31 | 1.32 | 1.33 | 1.31 | 1.33 | 1.40 |
| Indirect | 1.31 | 1.05 | 1.00 | 0.97 | 0.97 | 0.97 |
Total may not equal the sum due to rounding.
Energy intensity includes all types of energy consumed within the organization related to manufacturing and research and development.
Data changes from prior reporting reflect updated data and adjustments for acquired, divested and closed locations.
Energy consumption
Million gigajoules
Scroll right to view further data »
| 2024 | 2023 | 2022 | 2021 | 2020 | 2019 |
| Total | 8.97 | 8.14 | 8.24 | 8.55 | 8.19 | 9.01 |
| Direct | 4.49 | 4.53 | 4.70 | 4.92 | 4.73 | 5.33 |
| Indirect | 4.49 | 3.61 | 3.54 | 3.63 | 3.46 | 3.68 |
Total may not equal the sum due to rounding.
Direct energy consumption is the amount of primary energy we combust onsite. Our direct energy sources may include coal, natural gas, fuel distilled from crude oil, propane, biofuels, ethanol and hydrogen. Indirect energy refers to the energy we consume that is generated by external suppliers. We consume indirect energy through electricity, heat, steam and electricity generated from renewable energy sources, such as solar and wind. Data changes from prior reporting reflect updated data and adjustments for acquired, divested and closed locations from the 2019 baseline onward.
Energy consumption by source
Million gigajoules/percent of total energy consumption
Scroll right to view further data »
| 2024 |
| 2023 |
| 2022 |
| 2021 |
| 2020 |
| 2019 |
|
| Source | Million gigajoules | Percent | Million gigajoules | Percent | Million gigajoules | Percent | Million gigajoules | Percent | Million gigajoules | Percent | Million gigajoules | Percent |
| Nonrenewable fuels purchased and consumed | 4.49 | 50% | 4.53 | 56% | 4.70 | 57% | 4.92 | 58% | 4.73 | 58% | 5.33 | 59% |
| Nonrenewable electricity purchased | 2.05 | 23% | 2.20 | 27% | 2.37 | 29% | 2.44 | 29% | 2.47 | 30% | 2.70 | 30% |
| Steam/heating/cooling and other nonrenewable energy purchased | 1.21 | 13% | 0.37 | 5% | 0.38 | 5% | 0.41 | 5% | 0.35 | 4% | 0.36 | 4% |
| Total renewable energy purchased or generated | 1.23 | 14% | 1.04 | 13% | 0.79 | 10% | 0.77 | 9% | 0.64 | 8% | 0.62 | 7% |
| Total non renewable energy sold | 0.00 | - | 0.00 | - | 0.00 | - | 0.00 | - | 0.00 | - | 0.00 | - |
| Total nonrenewable energy consumption | 7.74 | 86% | 7.10 | 87% | 7.45 | 90% | 7.78 | 91% | 7.55 | 92% | 8.39 | 93% |
Energy costs
Millions of dollars
Scroll right to view further data »
| 2024 | 2023 | 2022 | 2021 | 2020 | 2019 |
| $139 | $155 | $193 | $127 | $94 | $106 |
Data changes from prior reporting reflect updated data and adjustments for acquired, divested and closed locations.