Water

Buildings painted with PPG coatings surrounded by gardens

We recognize that water is a finite, shared resource. We minimize water use in our facilities through conservation, innovation and reuse.

PPG uses water as an input to our production processes. Our largest source of water consumption is wash water to clean out our systems between production batches. Most of the water we use is pretreated and sent to municipal water treatment facilities and then released back into the local water system. We consider our impacts on the entire water basin, and we take into account the local environmental, regulatory and socioeconomic context of each of our sites.

PPG's most significant impact on water availability in local communities comes from our facilities located in water stressed areas. Recognizing that impacts from water use vary significantly depending on local conditions, our 2030 water reduction goal prioritizes water efficiency measures in areas with high water scarcity risk. In 2024, we succeeded in reducing the amount of water that we use in water stressed communities by 28% from our 2019 baseline, exceeding our 2030 water reduction target ahead of schedule. This represents a meaningful reduction in the impact of our water withdrawals on the communities where we operate.

Reduction in water intensity at priority sites in water scarce communities


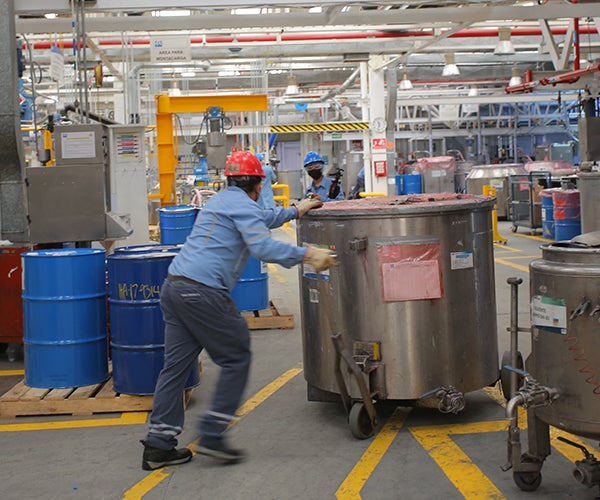
Workers moving large containers in factory

Reducing waste and saving water in San Juan del Río

At PPG's automotive coatings plant in San Juan del Río, Mexico, PPG people have taken a proactive approach to optimizing production processes. Historically, degreasers were manufactured based on incoming orders and as many as five different products were produced in the same tank on any given day. This approach led to multiple wash cycles between batches, with the water used for cleaning collected and disposed of as hazardous waste.

The team identified an opportunity to reduce water consumption by producing identical degreasing codes consecutively. By eliminating the need for washes between consecutive batches, the plant could significantly cut water usage and streamline operations. To implement this solution effectively, cross-functional protocols were established with planning, quality control and operations teams. Together, the teams reorganized production schedules to prioritize consecutive manufacturing of identical codes, minimizing washes between batches. In addition to cutting the facility’s water use by more than 15%, the amount of hazardous waste produced at the facility was decreased, saving the company disposal and remediation costs.

We achieved our goal by concentrating water efficiency initiatives on 23 priority sites, which were identified based on high water use and proximity to water stressed regions. For each priority site, we performed an in-depth review of water usage, identified water-intensive production processes, and developed action plans to limit water use and water waste. For example, we installed submeters to measure the water used for different production processes rather than relying on facility-level water meters. These submeters helped us to identify the most water-intensive production processes so we could develop strategies to reduce our usage. Having a more detailed view of our water usage also helped identify water lines in need of repair or replacement, which helped reduce water waste.

Workers with checklist in factory

Water conservation at Saultain

The PPG site in Saultain, France, has emerged as a model for addressing water conservation challenges. Designated as one of our water priority sites because of stress on the local water basin, the facility has taken a collaborative approach to reducing water withdrawals and use. Employees across the site are actively engaged in identifying and implementing innovative solutions that align with PPG’s commitment to reduce water intensity in water stressed communities.

In 2023, the Saultain facility upgraded the cooling system for its resin reactors, an initiative that saves over 3,000 cubic meters of water annually. This update stemmed from a suggestion by a maintenance technician who participated in sustainability-focused engagement activities, showcasing how employee involvement helps to drive meaningful change. Building on this momentum, the on-site laboratory introduced a closed-loop water cooling system in 2024, further reducing water consumption on site. These improvements underscore PPG’s dedication to continuous process optimization and deliver measurable financial benefits, saving the facility thousands of dollars each year.

Looking ahead, we will continue monitoring water scarcity risk in the communities where we operate using the World Resources Institute's Water Risk Atlas, and will invest in best practices toward reducing our water use where our activities impact stakeholders.

For more detailed information about our ongoing approach to water management, including a detailed description of our water mapping, reuse, wastewater treatment, see the bottom of this web page.

Multi-year data highlights

Water intensity

Cubic meters per metric ton of production

Scroll right to view further data »


202420232022202120202019
Water intensity for priority sites in water stressed areas0.971.181.491.381.421.34

Data changes from prior reporting reflect adjustments for acquired and divested locations from the 2019 baseline onward.

Water consumption - All sources

Million cubic meters

Scroll right to view further data »


202420232022202120202019
Withdrawn9.668.179.119.619.119.96
Discharge7.976.437.267.626.997.19
Net consumption (withdrawn minus discharge)1.691.741.851.992.122.77

Total may not equal the sum due to rounding.

Water withdrawal and water discharge data are provided by each location on a monthly basis using the best available data, including direct measurements when possible. Data changes from prior reporting reflect adjustments for acquired and divested locations.

2024 water withdrawn - All sources

Million cubic meters

SourceAmount withdrawn
Surface water0.01
Groundwater5.74
Seawater0.00
Produced water0.00
Third-party water3.90

2024 freshwater consumption

Million cubic meters

SourceAmount withdrawn
Municipal water withdrawn3.90
Fresh surface water withdrawn0.01
Fresh groundwater withdrawn5.74
Water discharge7.97
Net freshwater consumption1.68

Water usage in water-stressed regions

Scroll right to view further data »


202420232022202120202019
Total water withdrawn in water stressed regions1.031.241.571.641.541.59
Percent of total withdrawn11%15%17%17%17%16%
Percent of total consumed34%37%47%46%47%34%

Included facilities are in North America, South America, Europe, Australia and Asia. Data changes from prior reporting reflect adjustments for acquired and divested locations and updated water scarcity analysis.

Water non-compliances

Scroll right to view further data »


202420232022202120202019
Number9510676

Data cover non-compliances associated with water quality permits, standards and regulations and is based on the year that PPG is notified of the non-compliance by a governmental authority.

Water non-compliances are typically minor deviations from existing discharge permits. These incidents are thoroughly investigated, and corrective actions are implemented to minimize reoccurrence.