Avoiding serious incidents
Our operations and EHS teams take a proactive approach to minimizing the likelihood of serious incidents and fatalities (SIFs). When reviewing incidents, we prioritize our follow-up actions based on the actual and potential severity of injury. Training and education are provided to understand the concept of SIFs and identify activities that could result on potential SIFs. Incident investigations were reviewed to ensure that the quality of the root cause analysis and corrective actions were appropriate. These programs have contributed to meaningful improvements, reducing the total number of potential SIFs across PPG by 19% compared to 2024. We did not experience any actual SIFs in 2025.
Compliance audit program
Each year, PPG conducts health, safety and environmental audits at our sites to ensure compliance with our policies, procedures and applicable regulatory requirements. In 2025, we completed 47 health, safety and environmental audits across our global manufacturing sites, warehouses and company stores network.
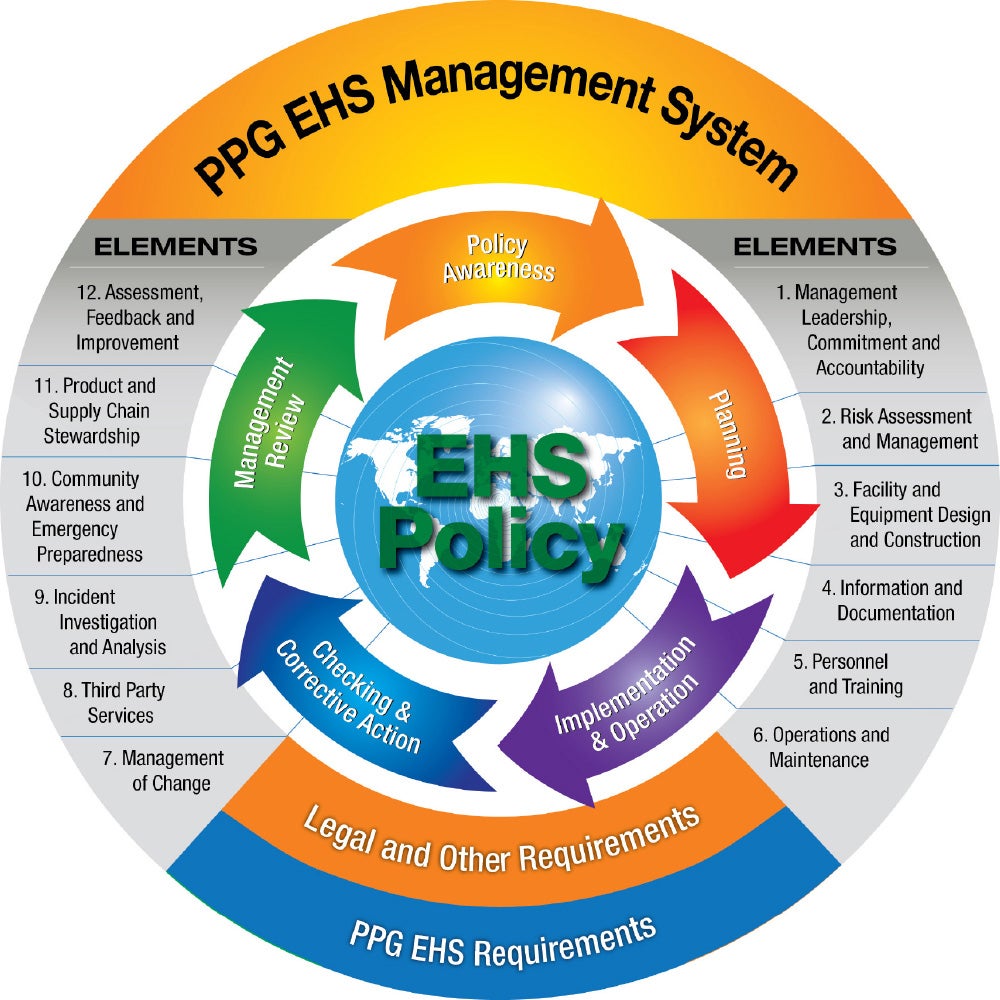
For more detailed information about our ongoing approach to safety and health, including our EHS management system, industrial hygiene approach, and EHS governance, see the bottom of this web page.
Multi-year data highlights
Global health and safety performance
Scroll right to view further data »
| 2025 | 2024 | 2023 | 2019 |
| Fatalities Number | 0 | 0 | 0 | 0 |
| Fatalities Rate | 0.00 | 0.00 | 0.00 | 0.00 |
| PPG injury and illness rate | 0.22 | 0.25 | 0.32 | 0.32 |
| Total recordable incident rate | 0.83 | 0.95 | 1.18 | 1.29 |
| Lost workday rate | 0.59 | 0.94 | 0.84 | 0.47 |
| Occupational disease rate | 0.01 | 0.01 | 0.07 | 0.15 |
The fatality rate is the number of fatalities multiplied by 200,000 and divided by the number of work hours. A PPG injury and illness (I&I) is defined as an injury or illness that is significant enough that it is unlikely to go unreported, regardless of the reporting culture in the region or site. PPG I&Is include fatalities, fractures, surgeries, hospitalizations, 30 or more days of lost work and other similar criteria. The PPG I&I rate is the number of injuries and illnesses that meet this definition multiplied by 200,000 and divided by the number of work hours. Total recordable incident rate is the number of Occupational Safety and Health Administration (OSHA) recordable injuries multiplied by 200,000 and divided by the number of work hours. Lost workday rate is the number of injuries and illness that resulted in days away from work or restricted activity multiplied by 200,000 and divided by the number of work hours. Occupational disease rate is the number of illnesses multiplied by 200,000 and divided by the number of work hours.
Data changes from prior reporting reflect updated data and adjustments for acquired and divested locations from the 2019 baseline onward.
2025 health and safety performance by region
Employees and supervised workers
Scroll right to view further data »
| Region | Fatalities | PPG injury and illness rate | Total recordable incident rate | Lost workday rate | Occupational disease rate |
| Asia Pacific | 0 | 0.09 | 0.34 | 0.26 | 0.00 |
| Europe, Middle East and Africa | 0 | 0.12 | 0.75 | 0.64 | 0.00 |
| Latin America | 0 | 0.07 | 0.20 | 0.05 | 0.00 |
| North America | 0 | 0.58 | 1.88 | 1.26 | 0.02 |
| Global | 0 | 0.22 | 0.83 | 0.59 | 0.01 |
2025 contractor health and safety performance by region
Scroll right to view further data »
| Region | Fatalities | PPG injury and illness rate | Total recordable incident rate | Lost workday rate | Occupational disease rate |
| Asia Pacific | 0.00 | 0.19 | 0.67 | 0.29 | 0.00 |
| Europe, Middle East and Africa | 0.00 | 0.29 | 2.58 | 1.43 | 0.00 |
| Latin America | 0.00 | 0.00 | 0.84 | 0.00 | 0.00 |
| North America | 0.00 | 0.89 | 2.68 | 0.89 | 0.00 |
| Global | 0.00 | 0.23 | 1.40 | 0.58 | 0.00 |
Process safety performance
Per million hours worked
Scroll right to view further data »
| 2025 | 2024 | 2023 | 2019 |
| Number of tier one incidents | 43 | 24 | 61 | 23 |
| Tier one incidents per million hours worked | 0.44 | 0.24 | 0.51 | 0.20 |
| Process safety total incident rate | 0.58 | 0.29 | 0.78 | 0.04 |
| Process safety incident severity rate | 0.48 | 0.26 | 0.28 | 0.02 |
Process safety total incident rate is the number of incidents multiplied by 1,000,000 and divided by the total annual hours worked by employees, contractors and subcontractors. Process safety incident severity rate is the total severity score for all process safety incidents multiplied by 1,000,000 and divided by the total annual hours worked by employees, contractors and subcontractors. Figures for 2024 have been corrected following identification of errors in the previous reporting cycle.
2025 health and safety audits by region and facility type
Scroll right to view further data »
| Manufacturing Sites (on-site) | Warehouses | Company Stores Network | Total |
| Asia Pacific | 12 | 0 | 1 | 13 |
| Europe, Middle East and Africa | 14 | 2 | 1 | 17 |
| Latin America | 6 | 0 | 0 | 6 |
| North America | 10 | 1 | 0 | 11 |
| Global | 42 | 3 | 2 | 47 |
Please see the data index section for a list of our process safety incidents in 2025.
Our approach to safety and health