We are PPG proud.
| Topic | 2030 target | Progress |
| Safety and health | 100% of employees go home safely each day. On our way, drive at least 5% annual improvement in injury and illness rate | 12.6% annual improvement in injury and illness rate |

| Topic | 2030 target | Progress |
| Safety and health | 100% of employees go home safely each day. On our way, drive at least 5% annual improvement in injury and illness rate | 12.6% annual improvement in injury and illness rate |

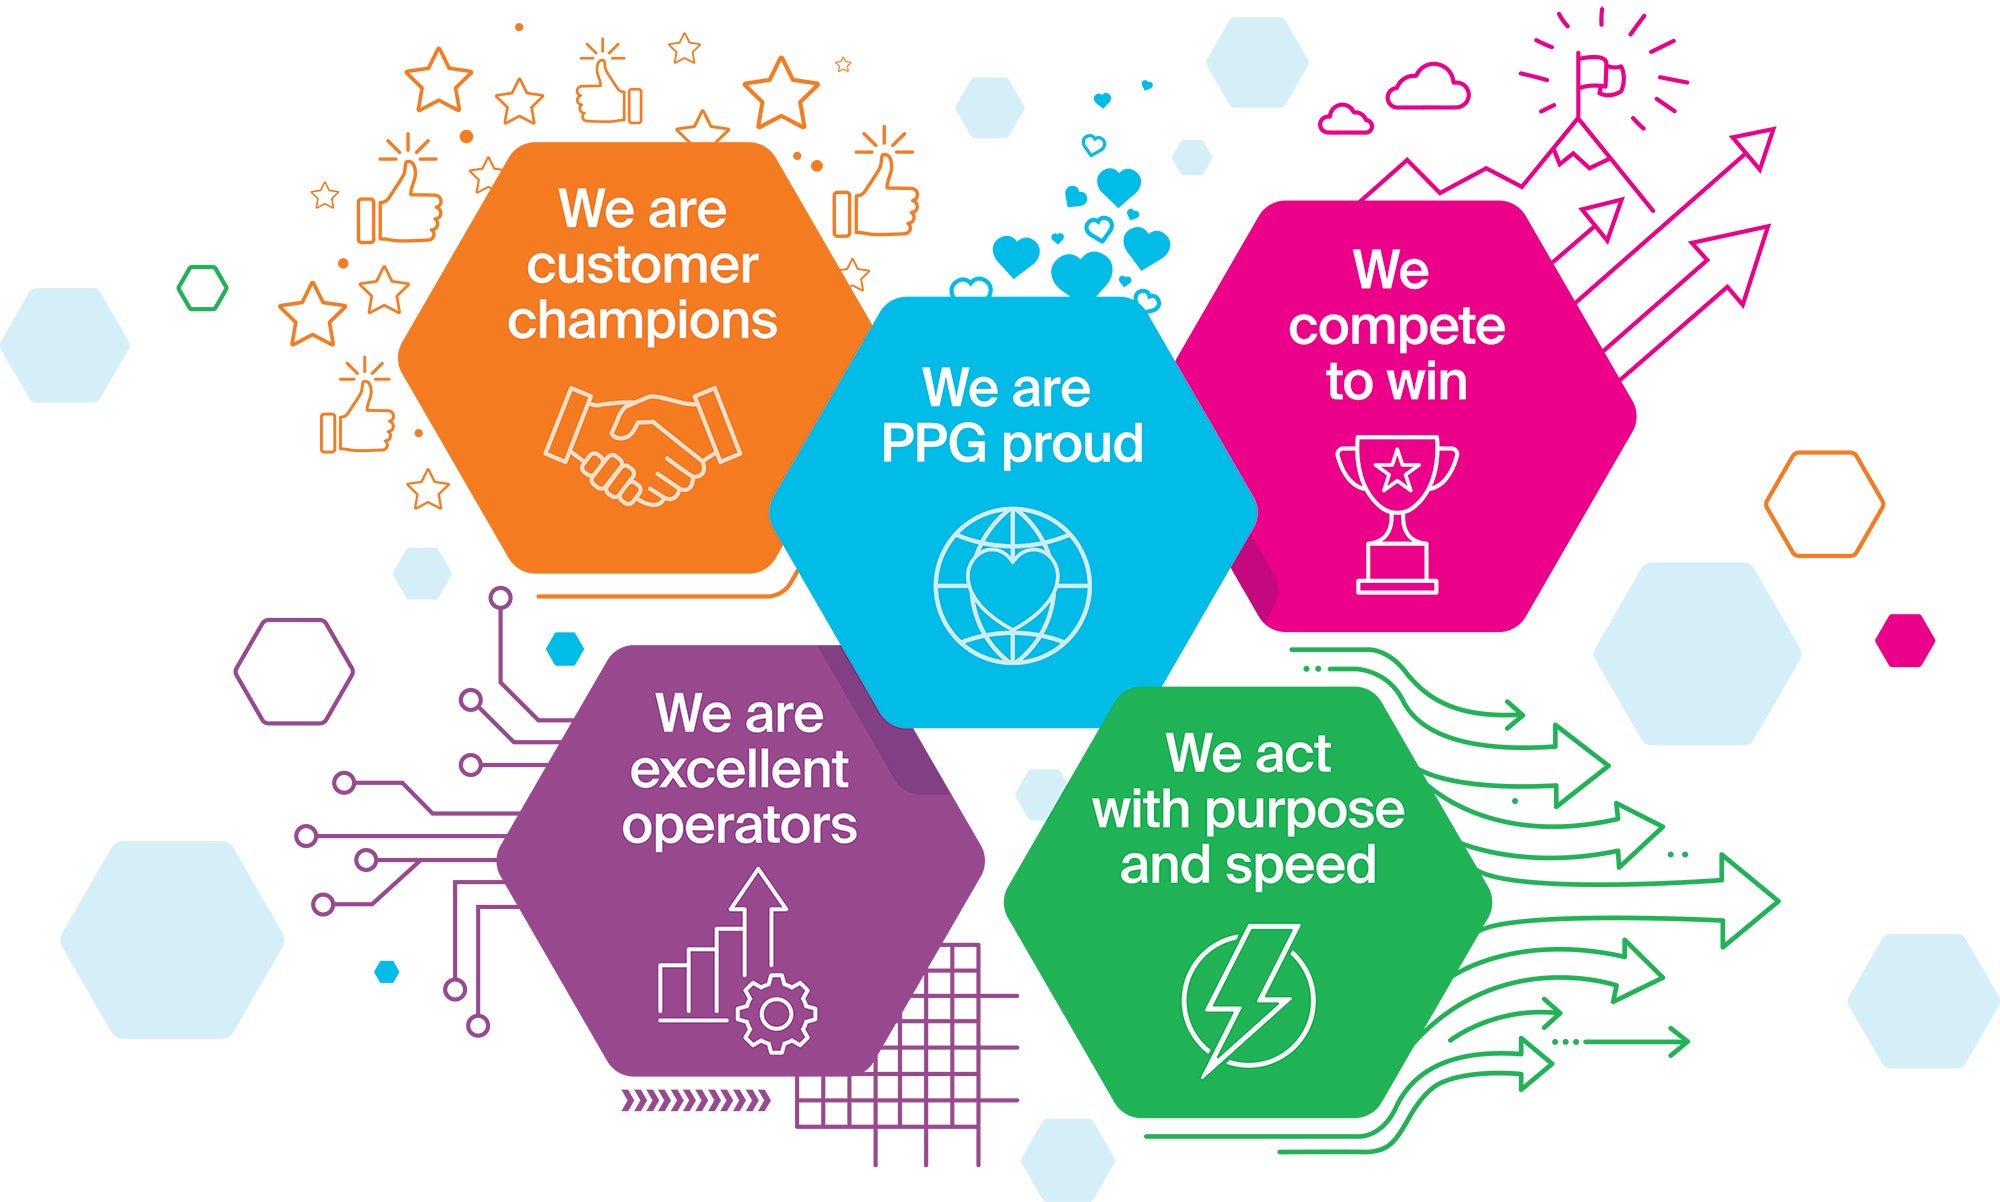
At PPG, our people and culture are at the heart of everything we do. We are dedicated to creating an environment where every employee is empowered to do their best and reach their full potential. Our shared guiding principles align culture with strategy, shaping behaviors that sharpen our competitive edge, accelerate progress and energize teams around the globe. By fostering a culture of growth and collaboration, we enable our team members to thrive, deliver exceptional results and live our purpose: We protect and beautify the world.
In this section, we disclose our performance and approach related to the following priority issues:
Our people section covers the following areas:
Numbers may vary in past and future reports as we continue to integrate new employees into our human resource systems and as employees continue to provide or update their self-identification status.
Scroll right to view further data »
| 2025 | 2024 | 2023 | 2019 |
| 44,000 | 46,000 | 50,000 | 47,600 |
Numbers are average for the full year and include PPG joint ventures.
Scroll right to view further data »
| Asia Pacific | Europe, Middle East and Africa | Latin America | U.S. and Canada | Total | |
| Female | 1,770 | 4,990 | 2,180 | 3,419 | 12,359 |
| Male | 5,412 | 10,902 | 6,156 | 7,802 | 30,272 |
| Other | 0 | 0 | 0 | 3 | 3 |
| Not specified | 2 | 10 | 8 | 0 | 20 |
| Total | 7,184 | 15,902 | 8,344 | 11,224 | 42,654 |
Numbers are as of Dec. 31, 2025, and do not include PPG joint ventures.
Scroll right to view further data »
| Full-time | Part-time | |
| Female | 11,780 | 579 |
| Male | 29,968 | 304 |
| Non-binary | 3 | 0 |
| Not specified | 19 | 1 |
| Total | 41,770 | 884 |
Numbers are as of Dec. 31, 2025, and do not include PPG joint ventures.
While we do not use the Federal Employer Information Report EEO-1 to guide our progress, our 2025 U.S. EEO-1 report is available online.
As of December 31, 2025